
Realistic Returns to Expect on a 401(k): and What Else Really Matters?
- W. Scott Hurt, CFP®, CPA

- Jun 5
- 15 min read
Updated: Jun 6
David Harper had a great year.
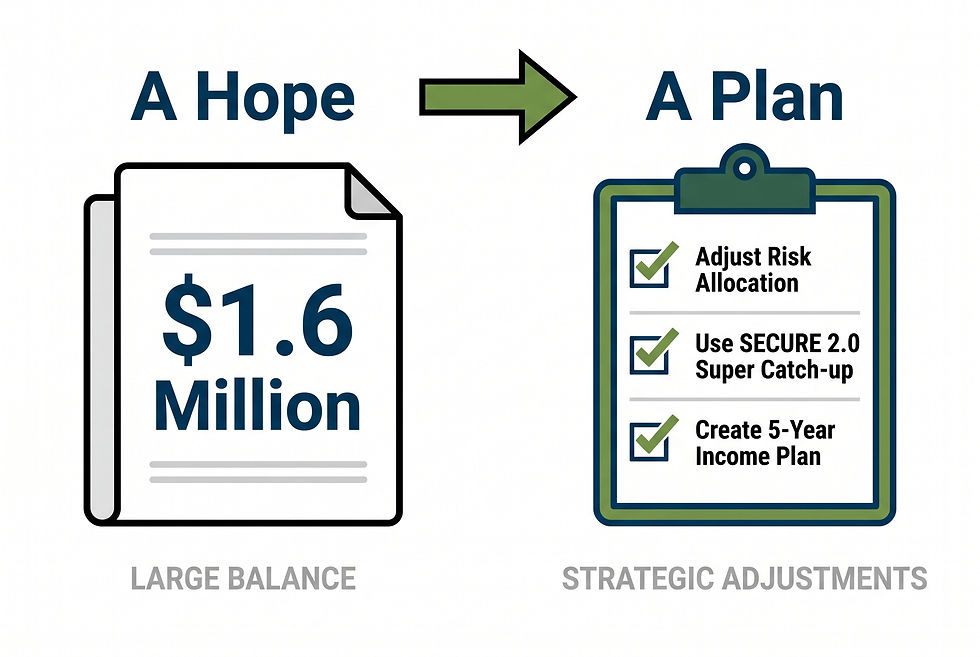
At 61, his 401(k) statement showed a 12.4% return. His balance had crossed $1.6 million.
He forwarded the statement to his wife with a single line: "We're on track."

Disclosure: The scenario regarding "David Harper’" is a hypothetical illustration used to demonstrate planning concepts. It does not represent the experience of actual clients. Hypothetical financial planning illustrations have inherent limitations, including that they are prepared with the benefit of hindsight and do not reflect actual results of any specific client situation.
He wasn't.
His allocation hadn't changed since he was 45. And he had no plan—not even a starting point—for what would happen to that $1.6 million once he stopped working.
The number on the statement told him what the market did last year. It told him nothing about what his 401(k) would produce in income over the next 25 years.
Many retirees ask about the average return in their 401(k). The better question though is: what are the things that actually determine how much you end up with — and are you managing them?
The answer changes your future.
Key Takeaways
The commonly cited average 401(k) return is 5%–8% per year — but that figure assumes a balanced 60/40 portfolio. Your actual return depends on your allocation, the timing of market downturns, and how you manage the transition from saving to spending.
The statement shows you last year's score. It doesn't tell you whether your allocation is right for where you are now, or whether you have a plan for any bad years that happen after you retire.
Sequence of returns risk is the most important 401(k) concept you've never planned for. Two investors with the same 30-year average return can retire with vastly different balances depending on when bad years hit.
SECURE 2.0 created a "super catch-up" for ages 60–63. In 2026, eligible savers can contribute up to $35,750 to a 401(k) — $11,250 more than the standard limit. Many high earners don't know this window exists.
Your real return — after inflation — is meaningfully lower than the number on your statement. Healthcare costs in retirement rise faster than general inflation. The gap between your nominal return and your actual spending power grows every year.
The average 401(k) balance is much larger than the median balance, which tells the real story. Vanguard's 2025 data shows an average balance of $148,153 — but a median of just $38,176. The average is skewed by high-balance outliers.
Want the full breakdown? Keep reading.
What Are Realistic Returns to Expect on a 401(k)?
The average 401(k) return is 5%–8% per year, based on a balanced portfolio of roughly 60% stocks and 40% bonds. Stock-heavy portfolios have historically produced closer to 10% — the long-run S&P 500 average since 1957, according to Fidelity. Conservative portfolios with more bonds typically land in the 3%–5% range.
These are starting points, not promises. The 5%–8% figure is a blended estimate based on historical market data. It doesn't account for your specific allocation, or for the year you happen to retire.
The S&P 500 has returned about 10% per year on average since 1957. But your 401(k) is almost certainly not 100% in the S&P 500. And even if it were, the 10% is a long-run average. (Trade That Swing historical data). The answer to "what are realistic returns to expect on a 401(k)" may have more to do with personal goals than average market returns.
The number that matters isn't what the market averaged. It's what you kept — after your allocation decisions and the timing of when good or bad years fell.
Why Does Asset Allocation Drive Your 401(k) Return?
Asset allocation drives your 401(k) return more than any other single factor. It is how you divide your money between stocks, bonds, and other assets. Not fund selection. Not market timing.
Think of it this way. If your 401(k) is 80% in stocks, a year like 2022 (S&P 500 down about 18%) hits you hard. If you're 40% in stocks, the same year hurts far less. The trade-off is that in a strong year — like 2023 or 2024 — the conservative portfolio captures far less of the upside.

Many 401(k) participants use target-date funds as their default. These are funds named for your expected retirement year — a 2030 fund, a 2040 fund. They start equity-heavy and shift to a higher bond allocation as the date approaches.
By year-end 2024, 67% of Vanguard plan participants held a professionally managed allocation — most of them in target-date funds.
Target-date funds are fine for many investors. But they use your age, not your risk tolerance and retirement income needs, to create the asset allocation. A retiree with $3 million and a pension has a very different risk capacity than a retiree at the same age with $400,000 and no other income. The same fund treats them identically.
This is where fiduciary planning earns its keep. A fee-only advisor builds an allocation around your actual income needs in retirement — not a birthdate.
See our guide on how different retirement income sources are taxed.
What the Statement Doesn't Tell You
A strong year on your statement is easy to misread. It tells you one thing: the market treated your portfolio well last year. What it doesn't tell you is whether you're actually ready for retirement.
At 35, a 12% year is exciting news. You have 30 years of compounding ahead. The balance growing is the whole point.
At 61, a 12% year tells you something much narrower. The market went up. Your balance grew. And you are now four years from the moment when that portfolio needs to produce income — every month, for the rest of your life.
Those are different situations, and they require different thinking.
Here is what your annual statement tells you:
How the market treated your portfolio last year
Whether your contributions are on track
Here is what it doesn't tell you:
Whether your allocation still makes sense for where you are in your timeline
Whether you have a plan for the first bad market year after you retire
Whether you're on pace for the income you'll actually need — not just reaching a balance milestone
David had been reading his statement as confirmation for 15 years. "The balance is going up. We must be doing something right." What he was actually reading was last year's score in a game that was about to change its rules.
Confidence built on a strong statement is not the same as confidence built on a plan.
From Saving to Spending: The Shift That Changes the Rules
This is the transition many 401(k) articles skip entirely. It can also be the most important one for anyone in their late 50s or early 60s.
When you're saving, the rules are relatively forgiving. Contribute as much as you can. Stay invested through downturns. Trust time to do its work. A bad year in 2015 barely registers by 2030.
When you start spending — when you begin drawing money out — the rules change in ways many investors don't anticipate.
Every dollar you take out during a down market is a dollar that never recovers. You're no longer adding to the account; you're drawing from it. A bad year in year two of retirement doesn't fade into the long-run average. In a worst-case scenario, it's what puts you on a path toward running out of money before you expect to.

The questions that matter change, too.
During the saving years, the right questions are: Am I contributing enough? Is my allocation aggressive enough to grow? Can I stay the course in a downturn?
During the spending years, the right questions are different: Which accounts do I draw from first — and in what order? How do I handle a down year without locking in losses I can't recover from? How do I manage my tax bracket as income flows from different accounts? What does my income look like in year one, and year five, and year fifteen?
Many people in their early 60s are still thinking in accumulation terms. David was. His goal had been to grow the balance to $1.6 million. He'd reached it. But he had never asked the next question: now what?
The plan for growing your 401(k) and the plan for living off it are not the same plan. They require different thinking, different allocation decisions, and often a different conversation entirely.
What is the Sequence of Returns Risk?
Sequence of returns risk means the order of annual returns matters as much as the average. A significant drop in year one of retirement does far more damage than the same drop in year fifteen. You're also taking money out during that down year, which locks in losses permanently.
This concept separates accumulation-phase thinking from retirement-phase thinking. And it's the one many 401(k) return articles skip entirely.
Here is why it matters. Imagine two retirees. Both have $1 million at retirement. Both average 7% per year over 25 years. But one has bad years early — 2000–2002 style — and the other has bad years late.
The retiree with bad years early runs out of money in year 22. The one with bad years later ends up with $1.5 million at death. Same average return. Very different outcomes.
When you take money out during a down year, you sell shares at a low price. Those shares are gone. They can't recover when the market bounces back. The portfolio stays smaller. During the saving phase, you add money, so downturns are just part of the journey.
During the spending phase, you take money out — and a down year during draws is not just a setback. It can compound into a structural problem.
This is why David's 12.4% year looked so reassuring on paper. He had no plan for what happens to that $1.6 million in the first five years after he stops working. If the market turns when he's two years into retirement, the statement he was so proud of now looks very different.

Learn more about how sequence of returns risk can impact your retirement.
What Does Your 401(k) Return Look Like After Taxes?
Your 401(k) return is a pre-tax number. The figure on your statement — whether it's 7% or 12% — is what the market returned on your account before the government gets its share.
Every dollar you pull from a traditional 401(k) in retirement is treated as ordinary income. For many of our clients, that means a meaningful portion of each withdrawal goes to federal and state taxes. After that, add inflation — which quietly reduces what each dollar buys each year.
The result: the real spending power your 401(k) produces in retirement is substantially lower than the headline return suggests. For many retirees, the gap between the number on the statement and what they actually spend is significant when taxes and inflation are both accounted for.
This gap compounds over a 20-year retirement. It's not dramatic year to year. But it changes how much your portfolio actually needs to produce.
The planning implication: tax-advantaged accounts aren't all the same. A dollar in a Roth account — which has already been taxed and grows tax-free — delivers more spending power than a dollar in a traditional 401(k), even at identical headline returns.
The right mix of account types is one of the most important and underappreciated decisions in retirement planning.

Many clients in their early 60s with large traditional 401(k) balances are in the Roth conversion window. Converting a portion each year can reduce the future tax drag on distributions.
That said, the upfront tax cost and Medicare premium impact should be part of the analysis. This works best when modeled with an advisor before acting.
The High-Net-Worth Reality.
The return on your 401(k) statement and the income your portfolio delivers in retirement are two different numbers. The gap between them — shaped by taxes, inflation, and account type — is one of the most important planning levers you have. A fiduciary advisor manages that gap, not just the return.
See our guide on how retirement income sources are taxed — covering 401(k) draws, Roth distributions, and capital gains.
What Does a Good 401(k) Return Look Like at 55, 60, and 65?
A good 401(k) return means different things at different stages. At 55, growth matters most. At 60, managing sequence-of-returns risk takes equal priority. At 65, how you draw down — not just how you grew — determines your actual income.
At 55: You may have 10+ years to retirement. A good return means your portfolio is equity-heavy enough to grow meaningfully, and you're contributing consistently. Depending on your goals, risks at this stage could include being too conservative too early and missing out on growth years.
At 60: You're entering the sequence-of-returns danger zone. A good return now includes a risk-managed allocation — one that protects against extreme losses in the next 3–5 years without sacrificing all growth potential. The SECURE 2.0 super catch-up is also available here (see below) — a meaningful opportunity many investors miss.
At 65: Good return now means having a distribution strategy in place. You're not simply invested for growth. You have a clear plan for which accounts to draw from first, how to manage your tax bracket, and how to handle a bad market year without selling assets you'll need later.
Wealth-tier reality check: For investors under $1M, the 5%–8% average is a useful planning benchmark. For investors at $2M–$5M+, the conversation shifts to tax efficiency, Roth conversion, and estate planning. At those levels, distribution decisions and account structure often matter more than squeezing an extra percentage point from market returns.
Which 2026 Contribution Moves Are High Earners Missing?
Workers aged 60–63 in 2026 can contribute $35,750 to a 401(k). That is the highest 401(k) limit in history — enabled by the SECURE 2.0 Act of 2022 (SECURE 2.0). Many high earners don't know this window exists. (SECURE 2.0).
The IRS raised 401(k) limits for 2026. The basic numbers:
Standard contribution limit: $24,500 (2026) — up from $23,500 in 2025. [Source: IRS IR-2025-111]
Age 50+ catch-up: $8,000 — total $32,500.
But here is the move many high earners are missing.
Under SECURE 2.0, workers aged 60, 61, 62, or 63 have a special catch-up contribution of $11,250, instead of the standard $8,000 catch-up. That brings the total to $35,750 in 2026.

This is called the "super catch-up." It applies to these four ages only. At 64, you revert to the standard $8,000 catch-up. The window is narrow, and plan participants don't always know it exists.
For a 60-year-old still working, the super catch-up is not just a number — it's one of the last major levers available to meaningfully increase a retirement portfolio. Four years of additional tax-deferred savings, compounding from a base that's already substantial, can make a real difference in retirement income capacity.
One more change that surprises high earners in 2026: If your Federal Insurance Contributions Act (FICA)-taxable earnings exceeded $150,000 in the previous year, catch-up contributions must go to Roth—not pre-tax. This is a SECURE 2.0 mandate in effect for 2026. (401K Catch-Up Contributions). Checking with HR on account setup may be necessary.
Here's What You Can Check Right Now
These questions will tell you more about your 401(k) health than the return on your statement.
1. Do you have an income plan for year one of retirement?
Not a balance target — an income plan. Do you know which account you'll draw from first? What your monthly after-tax income will look like? What you'll do if the market drops 20% in your first year of draws? If the answer is "not really," that's the most important gap to close before retirement.
2. Your allocation vs. your retirement date.
Look at your current stock/bond split. If you're 60 and have 90% in stocks, that's not aggressive investing — it's unmanaged risk. If you're 58 and in a very high percentage of bonds, you may be leaving growth on the table.
3. Your account balance vs. your income replacement target.
The gap between where you are and where the benchmark says you should be tells you how hard your portfolio needs to work — and whether contribution increases, distribution planning, or both are the right response.
4. Whether you qualify for the super catch-up.
Are you 60, 61, 62, or 63 in 2026 and still working? If so, confirm with your HR or plan administrator that your plan allows the $11,250 super catch-up. Not all plans have activated it yet.
Ready to Move From Average to Optimized?
David's story doesn't end with a $1.6 million statement and a quiet confidence that everything is fine.
When he finally sat down and looked at his situation, three things became clear. His allocation was too aggressive for his comfort now that he was four years from retirement.
He hadn't taken advantage of the SECURE 2.0 super catch-up at age 61.
And, most importantly, he had no income distribution plan for the first five years after he stopped working.
He didn't know which account he'd draw from first, what his tax situation would look like in year one, or what he'd do if the market turned against him before he had time to recover.
The adjustments weren't complicated. But they were the difference between a plan and a hope.
This hypothetical illustration is based on stated assumptions. Results vary based on individual facts, plan structure, and market conditions. Not a guarantee of future results. The cost of an unmanaged allocation and no distribution strategy isn't always a single number. It depends on the facts and circumstances of each individual client.
If you've never had a fiduciary advisor pressure-test your 401(k)'s allocation, distribution strategy, and tax structure, now may be the right time.
Want Us to Just Do Your Retirement Planning for You?
Schedule a free Strategy Session to discuss your situation and find out if we're a good fit to help you retire.
Reduce your retirement anxiety
Learn how we fully integrate investment management, tax planning in retirement, retirement income planning.
Find out whether we're the right fit to be your advisor—or if you're better off on your own
No pressure. No obligation. Just an honest conversation.
Frequently Asked Questions
What is the average 401(k) return per year?
The average 401(k) return is 5%–8% per year for a balanced portfolio (roughly 60% stocks, 40% bonds). Stock-heavy portfolios have historically returned closer to 10%, in line with the long-run S&P 500 average. Conservative portfolios with more bonds typically return 3%–5%. These are historical averages. Your actual return depends on your allocation, market timing, and how you manage the transition from saving to spending.
Is a 7% return on a 401(k) good?
A 7% return is in line with the long-run average for a balanced portfolio. But whether it's good depends on where you are. At 45, a 7% return with a long runway ahead is a solid foundation. At 62, a 7% return without a distribution plan is just a number. What matters near retirement is not just the return, it's whether you have a strategy for converting that balance into income you can live on.
What is a realistic 401(k) return over 20 years?
Over any rolling 20-year period in S&P 500 history, returns have ranged from +3.1% to +17.7%, with a typical range of 7%–11% annually. For a diversified 401(k) with bonds, a realistic long-run planning assumption is 5%–7%. (Trade That Swing historical data). What varies most isn't the average—it's the sequence. When bad years fall relative to your retirement date matters enormously.
How much should my 401(k) grow in a year?
There is no single right answer — it depends entirely on your allocation. A stock-heavy portfolio in a strong market year may grow 15%–20%. A conservative portfolio may grow 5%–6%. A single strong year can be misleading. What matters more is whether your portfolio is on track for the income you'll need in retirement — and whether your allocation is appropriate for where you are in your timeline.
What is the average 401(k) balance at retirement?
According to Vanguard's How America Saves 2025 report, the average 401(k) balance among Vanguard plan participants was $148,153 at year-end 2024. But the median balance was just $38,176—far more representative of the typical saver. (Vanguard How America Saves 2025). For Fidelity plan participants, the average hit a record $146,400 in Q4 2025. For many of our clients, the conversation is less about accumulating and more about protecting what's there and structuring how it gets spent.
What is the 2026 401(k) contribution limit?
The standard 2026 limit is $24,500. Workers aged 50 or older can contribute an additional $8,000 catch-up — a total of $32,500. Under the SECURE 2.0 Act of 2022, workers aged 60–63 qualify for a super catch-up of $11,250, bringing their 2026 total to $35,750.
How does the sequence of returns risk affect my 401(k)?
Sequence of returns risk is the danger that arises in a bad stretch of market returns in the early years of retirement when you're drawing income and can't add money back into the portfolio. This can permanently impair a portfolio even if the long-run average is fine. The same average return, with bad years early rather than late, can mean the difference between a portfolio that lasts 30 years and one that runs dry in 22. This is why a distribution strategy matters as much as an accumulation strategy near retirement.
The Bottom Line.
The average 401(k) return is 5%–8% per year for a balanced portfolio — but that number is just the starting point. Your outcome depends on three things: your allocation relative to where you are in your timeline, how you manage the transition from saving to spending, and when downturns occur relative to your retirement date. A fiduciary advisor's job is to manage all three.
Ready to get the help you need to retire with peace of mind?
Contact us today for a Free Strategy Session.

About the author:
Senior Financial Advisor
Scott is a Financial Advisor for Covenant Wealth Advisors, a CERTIFIED FINANCIAL PLANNER™ practitioner and a Certified Public Accountant (CPA). He has over 17 years of experience in the financial services industry in the areas of financial planning, tax planning, and investment management.
Disclosures: Covenant Wealth Advisors is a registered investment advisor with offices in Richmond, Reston, and Williamsburg, VA. Registration of an investment advisor does not imply a certain level of skill or training. Past performance is no guarantee of future returns. Investing involves risk and possible loss of principal capital. The views and opinions expressed in this content are as of the date of the posting, are subject to change based on market and other conditions. This content contains certain statements that may be deemed forward-looking statements. Please note that any such statements are not guarantees of any future performance and actual results or developments may differ materially from those projected. Please note that nothing in this content should be construed as an offer to sell or the solicitation of an offer to purchase an interest in any security or separate account. Nothing is intended to be, and you should not consider anything to be, investment, accounting, tax, or legal advice. If you would like accounting, tax, or legal advice, you should consult with your own accountants or attorneys regarding your individual circumstances and needs. This article was written and edited by a CERTIFIED FINANCIAL PLANNER™ professional with the assistance of AI. No advice may be rendered by Covenant Wealth Advisors unless a client service agreement is in place. Hypothetical examples are fictitious and are only used to illustrate a specific point of view. Diversification does not guarantee against risk of loss. While this guide attempts to be as comprehensive as possible but no article can cover all aspects of retirement planning. Be sure to consult an advisor for comprehensive advice.


